3.2.2 Connection
Demand Analysis
The demand for connection to the networks in 2024 increased in comparison to 2023. Total amount of applications for connections, received by the Company totaled 49,796 (+1,548 or +3% YoYyear on year), the increase driven by enhanced availability of connection as a result of the transition to interactive CR channels and increased purchasing power due to concessional real estate loans and regional infrastructure development. In 2024, the Company concluded 28,438 contracts (+3% YoYyear on year) and executed 31,374 contracts (+0.3% YoYyear on year). Capacity demand in concluded contracts increased by 6%.
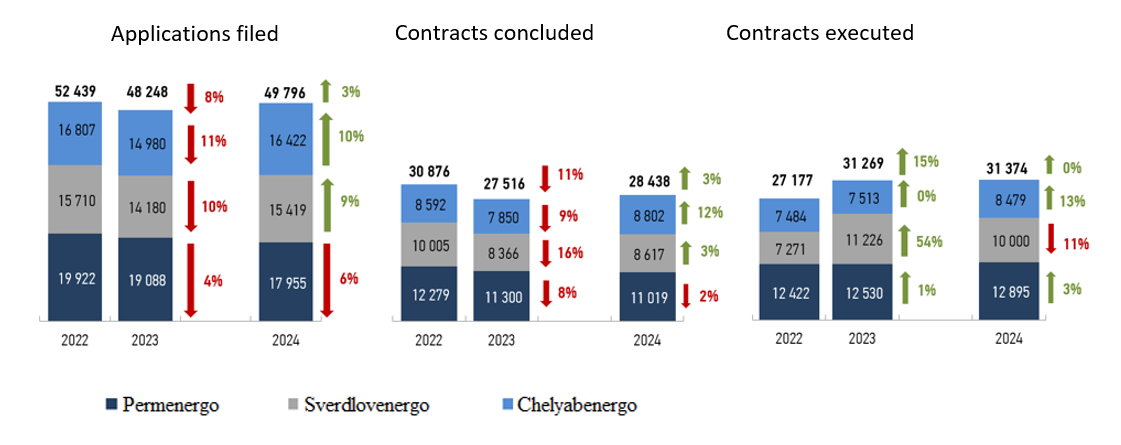
Demand for connection (pcs)*
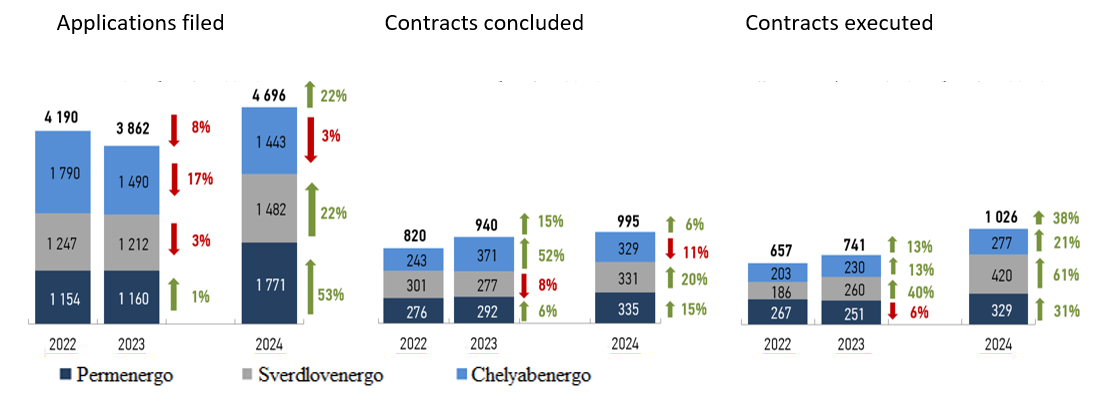
Demand for connection (MWmegawatt)*
| Indicator | MU | 2022 | 2023 | 2024 | 2024/2023, % |
|---|---|---|---|---|---|
| Applications filed | pcs | 52,439 | 48,248 | 49,796 | 3% |
| Applications filed | kW | 4,190,455 | 3,862,322 | 4,695,606 | 22% |
| Contracts concluded | pcs | 30,876 | 27,516 | 28,438 | 3% |
| Contracts concluded | kW | 820,289 | 939,553 | 995,141 | 6% |
| Contracts executed | pcs | 27,177 | 31,269 | 31,374 | 0% |
| Contracts executed | kW | 656,721 | 740,711 | 1,025,680 | 38% |
| Active contracts | pcs | 21,324 | 16,831 | 13,406 | -20% |
| Active contracts | kW | 1,761,949 | 1,798,745 | 1,716,418 | -5% |
| Executed contracts by categories of applicants: | |||||
| 0-15 kW inclusive | pcs | 25,092 | 28,517 | 28,452 | 0% |
| 15-150 kW inclusive | pcs | 1,793 | 2,317 | 2,485 | 7% |
| 150-670 kW | pcs | 212 | 313 | 308 | -2% |
| 670+ kW | pcs | 78 | 120 | 123 | 2% |
| Generation | pcs | 2 | 2 | 6 | 200% |
| 0-15 kW inclusive | kW | 316,095 | 310,678 | 319,770 | 3% |
| 15-150 kW inclusive | kW | 122,753 | 148,680 | 151,591 | 2% |
| 150-670 kW | kW | 62,575 | 84,462 | 86,091 | 2% |
| 670+ kW | kW | 154,494 | 175,990 | 357,611 | 103% |
| Generation | kW | 805 | 20,900 | 110,617 | 429% |
| Revenues from connection by categories of applicants: | |||||
| 0-15 kW inclusive | RUBruble million | 92 | 661 | 1,162 | 76% |
| 15-150 kW inclusive | RUBruble million | 93 | 244 | 368 | 51% |
| 150-670 kW | RUBruble million | 332 | 534 | 807 | 51% |
| 670+ kW | RUBruble million | 706 | 455 | 723 | 59% |
| Generation | RUBruble million | 17 | 16.53 | 463 | 2,698% |
| Executed contracts by industries: | |||||
| Individuals | pcs | 23,323 | 26,601 | 26,647 | 0,2% |
| Agriculture, forestry, fishery | pcs | 174 | 227 | 180 | -21% |
| Manufacturing industry | pcs | 132 | 202 | 238 | 18% |
| Production and distribution of electricity, gas and water | pcs | 139 | 234 | 152 | -35% |
| Real estate development | pcs | 514 | 708 | 708 | 0% |
| Trade industry | pcs | 302 | 409 | 547 | 34% |
| Transportation and telecommunications | pcs | 620 | 656 | 475 | -28% |
| Public health, education, social services | pcs | 93 | 193 | 155 | -20% |
| Other | pcs | 1,880 | 2,039 | 2,272 | 11% |
| Individuals | kW | 300,065 | 294,873 | 303,222 | 3% |
| Agriculture, forestry, fishery | kW | 15,291 | 20,009 | 18,150 | -9% |
| Manufacturing industry | kW | 56,791 | 63,440 | 144,588 | 128% |
| Production and distribution of electricity, gas and water | kW | 30,178 | 69,059 | 241,499 | 250% |
| Real estate development | kW | 38,743 | 50,674 | 46,210 | -9% |
| Trade industry | kW | 15,038 | 25,419 | 33,365 | 31% |
| Transportation and telecommunications | kW | 11,078 | 9,782 | 30,973 | 217% |
| Public health, education, social services | kW | 4,865 | 17,169 | 11,133 | -35% |
| Other | kW | 184,671 | 190,285 | 196,540 | 3% |
Cancelled contracts
|
Year/Branch |
Connection contracts cancelled during the reported period * |
||
|---|---|---|---|
| pcs | MW | Contract value, RUBruble million, net of VATvalue-added tax | |
| Permenergo | 311 (-54% on 2021) | 23 (-30%) | 102 (+23%) |
| Sverdlovenergo | 268 (-25%) | 32 (-49%) | 47 (-20%) |
| Chelyabenergo | 538 (-30%) | 27 (-74%) | 36 (-64%) |
| 2022 TOTAL | 1,117 (-38%) | 82 (-59%) | 185 (-23%) |
| Permenergo | 169 (-46% on 2022) | 79 (242%) | 146 (43%) |
| Sverdlovenergo | 311 (16%) | 30 (-5%) | 101 (115%) |
| Chelyabenergo | 286 (-47%) | 35 (31%) | 358 (893%) |
| 2023 TOTAL | 766 (-31%) | 144 (76%) | 605 (227%) |
| Permenergo | 184 (9% on 2023) | 26 (-67%) | 206 (41%) |
| Sverdlovenergo | 92 (-70%) | 56 (85%) | 132 (30%) |
| Chelyabenergo | 235 (-18%) | 17 (-50%) | 155 (-57%) |
| 2024 TOTAL | 511 (-33%) | 100 (-31%) | 492 (-19%) |
Connection requests are waived due to:
- changes in terms for construction of filer’s facility or lack of intentions to construct any facilities;
- lack of funds;
- expiration of specifications.
During 2024, Permenergo cancelled 184 contracts (+9%YoY) with the total capacity of 26 MWmegawatt and worth RUBruble 206 million (net of VATvalue-added tax). Most of the contracts (63%) were cancelled by 0-15 kW applicants, 40% of cancellations done by individuals.
During 2024, Sverdlovenergo cancelled 92 contracts (-70%YoY) with the total capacity of 56 MWmegawatt and worth RUBruble 132 million (net of VATvalue-added tax). Most of the contracts (46%) were cancelled by 0-15 kW applicants, 38% of cancellations done by individuals.
During 2024, Chelyabenergo cancelled 235 contracts (-18%YoY) with the total capacity of 17 MWmegawatt and worth RUBruble 155 million (net of VATvalue-added tax). Most of the contracts (66%) were cancelled by 0-15 kW applicants, 60% of cancellations done by individuals.
The most important connections in 2024
- MKUmunicipal public institution “UTZ” (RUBruble 24.7 million, 0.44 MWmegawatt): electricity supply of a school (advancement of education in the Perm region);
- MKUmunicipal public institution “UTZ” (RUBruble 22.6 million, 0.37 MWmegawatt): electricity supply of a multi-apartment residential building (improvement of the quality of life in the Perm region);
- GKU PK “UKS of the Perm region” (RUBruble 2.6 million, 0.28 MWmegawatt): electricity supply of a health clinic (improvement of the quality of life in the Perm region);
- OOOLimited Liability Company “Khevel RG” (RUBruble 238 million, 33.5 MWmegawatt): development of renewable energy generating facilities;
- AOJoint-Stock Company OEZ “Titan valley” (RUBruble 7.9 million, 16.3 MWmegawatt): improvement of investment climate and development of industrial potential of the Sverdlovsk region;
- UMP “Vodokanal of Urban District Revda” (RUBruble 34 million, 0.25 MWmegawatt): improvement of the quality of life in the Sverdlovsk region;
- ZAO KZPV (RUBruble 1.69 million, 6.1 MWmegawatt): improvement of investment climate and development of industrial potential of the Sverdlovsk region;
- GBUstate budgetary institution “Karabash Urban District Administration” (RUBruble 11.3 million, 0.25 MWmegawatt): connection of designed packaged transformer substation to supply electricity to a water supply inlet (improvement of the quality of life in the Chelyabinsk region);
- OOOLimited Liability Company ChSGS (RUBruble 201 million, 36 MWmegawatt): connection of a designed 25 MVA 110/10 kV transformer to supply electricity to a communal base depot (development of the production industry in the Chelyabinsk region);
- MU KGO “Construction Management” (RUBruble 7.4 million, 0.05 MWmegawatt): connection of a water station (improvement of the quality of life in the Chelyabinsk region);
- MBU “Argayash Municipal District Administration” (RUBruble 11.8 million, 0.2 MWmegawatt): connection of a pre-school educational institution (advancement of education in the Chelyabinsk region).