3.3.3 Environment Protection
Environmental Policy
PAOPublic Joint-Stock Company Rosseti Ural, being one of the largest distribution grid companies of Russia, is interested in environment safety and compliance of its operations with environmental regulations. Company’s facilities (power lines, substations, production sites) have minor impacts on the environment. The Company’s operations include such environmental impacts, as waste generation, physical effect, air contamination (minimal emissions); the Company has no wastewater discharges to surface water bodies.
The PAOPublic Joint-Stock Company Rosseti Ural’s environment policy was adopted by the Board of Directors[35]. The focus of the Environmental Policy is to preserve a benevolent environment for current and future generations.
PAOPublic Joint-Stock Company Rosseti Ural has 197 facilities with an adverse impact on the environment, incl. 121 III category facilities and 76 IV category facilities. PAOPublic Joint-Stock Company Rosseti Ural has a license for collection, transportation, processing, utilization, deactivation, dumping of hazard Class I-IV waste (in terms of transportation of hazard Class I-IV waste)[36]. The Company has 10 extraction licenses and extracts groundwater at 11 wells.
In 2024, the Company conducted activities to preserve biodiversity and land. 5,929 bird-protection devices were mounted on 6-35kV power lines in the Perm, Sverdlovsk and Chelyabinsk regions. The bird-protection devices were mounted on power lines located near water reservoirs, bird migration routes.
In 2024, the Company arranged a set of trainings for the employees: 63 directors and specialists underwent training on environment protection and ecological security, 94 employees were trained to process hazard Class I-IV waste.
Environmental Costs
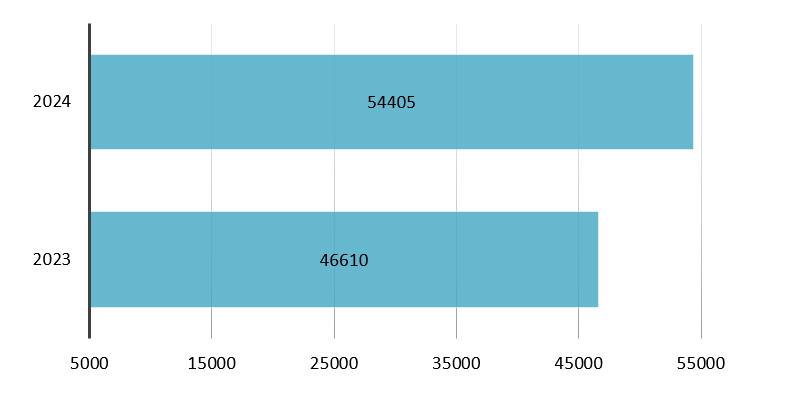
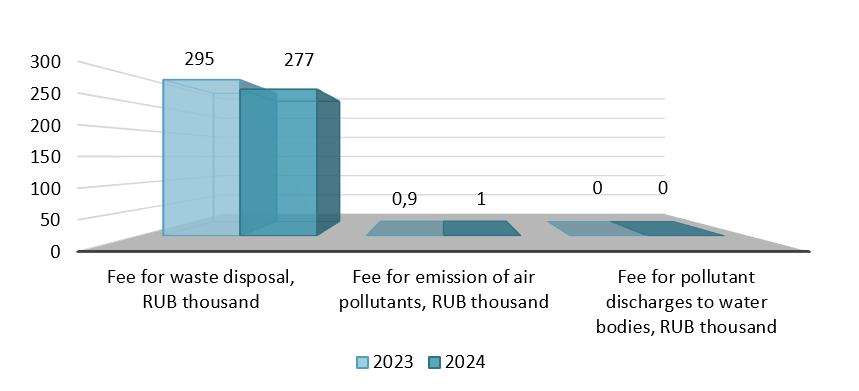
A 14% increase of 2024 environmental costs, in comparison to 2023, was due to development of drafts of sanitary protection zones, inventory of pollutant emissions, arrangement of 92 SMW sites and purchase of SMW containers, increased expenses on installation of bird-protection devices and increased number of bird-protection devices. A slight decrease of “polluter-pays” charges in 2024 was due to recalculation of target and actual “polluter-pays” charges.
Environmental costs, RUBruble thousand
«Polluter Pays» charges
‘
Air protection activities
The primary air contamination sources are motor vehicles (motor vehicle storage shed, open air or indoor car parks), machine tool use area, welding stations and workshops. All contamination sources have a minor negative impact on the environment. Under the environment control programs the Company conducts laboratory and instrumental surveys of stationary waste resources, controls the quality of air on the boundary of sanitary protection zones, and prepares survey protocols every year. In 2024, the Company conducted laboratory survey of air, impact of physical factors on sites. Survey protocols were received. Survey showed that emissions are within the limits. Due to the fact that our contribution to atmospheric pollution at the border of the SPZ and the residential zone does not exceed acceptable values, additional measures to reduce emissions of pollutants are not required. Our production sites do not produce over-the-limits noise, therefore, no noise barriers are required. PAOPublic Joint-Stock Company Rosseti Ural is not a regulated company, since greenhouse gas emissions are less than 50 thousand tons of carbon dioxide per year (in 2024 greenhouse gas emissions totaled 30 thous. tons per year). The volume of air pollutant emissions in 2024 decreased by 6% due to inventory of pollutant emissions.
Protection and sustainable use of water resources
The Company installed water meters, undergoing regular checks, to rationalize the use of water resources and register water consumption. The Company concludes contracts on water supply and disposal on time, conducts administrative procedures, improves performance discipline in terms of energy saving, conducts laboratory surveys of quality of ground water, oversees compliance with license agreements. All requirements of license agreements were timely and fully complied with. Laboratory surveys of quality of ground water were conducted.
A 7% decrease of water consumption and wastewater disposal in 2024, in comparison to 2023, was influenced by water saving measures in office and production buildings as well as energy-saving and energy-efficiency.
Waste Management
Pursuant to the Regulations[37], in compliance with the approved annual schedule, the Company conducts production environmental control. In 2024, all scheduled inspections were conducted, activities to eliminate exposed violations were conducted, with the rest of activities planned for production programs in future periods.
Wastes from the Company’s operations are stored at specially equipped waste accumulation locations (containers, reservoirs, sites located on impervious surface), easily accessible for lifting devices and motor vehicles. Waste accumulation sites are marked and located in line with approved schemes. Memos on waste accumulation sites are placed on stands.
Wastes are timely handled for utilization, decontamination, allocation under relevant contracts. Employees conduct visual checks of waste accumulation locations and compliance with laws. In 2024, the Company arranged 92 sites for containers for solid municipal waste, 2 sites for waste automobile tires, 6 sites for ferrous metals, 4 sites for oil-filled equipment, arranged 25 waste paper accumulation sites, acquired 166 containers for oily rags, solid municipal waste, factory waste, 50 spill pans for oil waste, 31 canvas covers to protect wastes from precipitation, 1,260 liters of Trans-neft decontaminant, 2.6 tons of absorbent to liquidate possible oil product splashes. All the measures reduce adverse impact on land.
| Indicator | MU | 2022 | 2023 | 2024 | 2024/2023, % |
|---|---|---|---|---|---|
| Emissions of air pollutants | Tons | 38.02 | 38.29 | 35.92 | -6% |
| Water consumption | m3 | 108.53 | 104.53 | 97.21 | -10% |
| Waste handed over for recycling | Tons | 1,356.88 | 2,808.11 | 1,118.9 | -60% |
| “Polluter-pays” charges | RUBruble thous. | 414.75 | 295.6 | 277.8 | -6% |
| Discharging of contaminants into water bodies | Thous. m3 | 0 | 0 | 0 | |
| Bird-protection devices | pcs | 5,177 | 4,594 | 5,929 | +29% |
Energy consumption and energy-saving
The Company has the Energy-saving and Enhanced Energy Efficiency Program through 2028[38]. The Program stipulates the list of target indicators based on the Federal Law[39] and decrees of regional tariff regulators.
Information on completion of the target indicators in 2024
| Target indicator | MU | 2023 real value | 2024 real value |
|---|---|---|---|
| Electricity losses | kWhkilowatt-hour million | 3,848.5 | 4,059.8 |
| In-house load of substations | kWhkilowatt-hour million | 71.8 | 83.4 |
| Electricity consumption for economic needs | kWhkilowatt-hour million | 68.3 | 69.5 |
| Thermal power consumption for economic needs | GCal | 44,648.2 | 45,969.9 |
| Natural gas consumption for economics needs | Thous. m3 | 550.8 | 544.6 |
| Hot water consumption for economic needs | Thous. m3 | 3.2 | 4.0 |
| Cold water consumption for economic needs | Thous. m3 | 96.2 | 97.7 |
| Gasoline consumption by vehicles and machinery | Thous. liters | 5,738.7 | 5,497.5 |
| Diesel consumption by vehicles and machinery | Thous. liters | 6,428.8 | 6,332.9 |
| Equipment with LEDlight emitting diode energy-saving lighting facilities | % | 94.2 | 92.2 |
The 2024 results show a predominantly negative trend compared to the previous year across all resource categories, except for natural gas consumption for economic needs and motor fuel. The increase in electricity losses was mainly influenced by the acceptance of grid equipment onto the balance sheet, as well as a rise in total supply. The growth in in-house load of substations, and electricity and thermal energy for economic needs, is linked to temperature factors. Additionally, inaccuracies in meter readings and malfunctions of metering devices were identified in several buildings; corrective measures were taken, and the meters were put into operation. The reduction in gas consumption for economic needs is associated with changes in the operating modes of facilities and equipment adjustments. The main factors affecting changes in water consumption were meter malfunctions and recalculations. The decrease in gasoline and diesel fuel consumption is due to vehicles being taken out of service for repairs and an overall reduction in requests for vehicle use. The level of energy-saving lighting devices using LEDlight emitting diodes totaled 92.2%. Most of the target-oriented and side activities of the Energy-saving Program have been completed. Additionally, unscheduled activities aimed at reducing electricity losses and resource consumption for economic needs were implemented.
| Activities | MU |
Actual effect in 2024 |
||
|---|---|---|---|---|
| In MU | tfoe | RUB million | ||
| Reduction of electricity losses | Million kWhkilowatt-hour | 14.1 | 1,686.8 | 49.1 |
| Reduction of in-house load of substations | Million kWhkilowatt-hour | 0.4 | 45.1 | 1.3 |
| Reduction of consumption for economic needs |
Million kWhkilowatt-hour | 0.9 | 113.5 | 5.6 |
| Thousand GCal | 0.6 | 89.7 | 1.1 | |
| Thousand m3 (gas) | 0.7 | 0.8 | 0.006 | |
| Thousand m3 (water) | 0.05 | 0.002 | ||
|
Reduction of fuel consumption |
Thousand liters (gasoline) | 20.4 | 23.1 | 0.9 |
| Thousand liters (diesel) | 22.1 | 27.2 | 1.2 | |
| Total effect on target-oriented activities |
Million kWhkilowatt-hour | 15.4 | 1,845.4 | 55.9 |
| Thousand GCal | 0.6 | 89.7 | 1.1 | |
| Thousand m3 (gas) | 0.7 | 0.836 | 0.006 | |
| Thousand m3 (water) | 0.05 | 0.002 | ||
| Thousand liters | 42.5 | 50.3 | 2.1 | |
| Total | 1,986.2 | 59.2 | ||
| Total effect on the Program (incl. side activities) |
Million kWhkilowatt-hour | 226.2 | 27,142.2 | 817.8 |
| Thousand GCal | 0.6 | 89.7 | 1.1 | |
| Thousand m3 (gas) | 0.7 | 0.8 | 0.006 | |
| Thousand m3 (water) | 0.05 | 0.002 | ||
| Thousand liters | 42.5 | 50.3 | 2.1 | |
| Total | 27,283.1 | 821.1 | ||
Total effect from target-oriented activities under the Energy-saving Program for 2024 totaled 15.4 million kWhkilowatt-hour, 627.6 GCal, 724.5 m3 of gas, 45.8 m3 of water and 42.5 thousand liters of fuel (side activity) or RUBruble 59.2 million (incl. RUBruble 2.1 million from side activities).
Total effect from target-oriented activities of the Energy-saving Program (incl. side activities), Reduction of Losses Program and other side activities in 2024 reached 27,283.1 tfoe or RUBruble 821.1 million in money terms.
| Indicator | MU | 2022 | 2023 | 2024 | 2024/2023, % |
|---|---|---|---|---|---|
| Consumption of fuel and energy resources for economic needs (office and production buildings) | Thousand tfoe | 16.1 | 15.2 | 15.5 | 2.2 |
| RUBruble million | 389.7 | 409.4 | 434.1 | 6.0 | |
| Consumption of fuel by transport and machinery | Thousand tfoe | 14.5 | 14.4 | 14.0 | -2.7 |
Consumption of energy resources in 2024
| Resources | MU | 2024 target value | 2024 real value | Variance, % | Notes |
|---|---|---|---|---|---|
| Nuclear energy |
N.A. |
||||
| Thermal power | GCal | 43,710.1 | 45,969.9 | 5.2 | Temperature factor |
| RUBruble million | 84.4 | 87.0 | 3.0 | ||
| Electricity | Million kWhkilowatt-hour | 4,098.5 | 4,129.3 | 0.8 | Increased total supply |
| RUBruble million | 15,075.1 | 14,229.7 | -5.6 | ||
| Electromagnetic energy |
N.A.
|
||||
| Oil |
N.A.
|
||||
| Gasoline | Thousand liters | 5,897.9 | 5,497.5 | -6.8 | |
| RUBruble million | 264.0 | 232.6 | -11.9 | ||
| Diesel | Thousand liters | 6,643.0 | 6,332.9 | -4.7 | |
| RUBruble million | 354.5 | 339.7 | -4.2 | ||
| Mazut |
N.A. |
||||
| Natural gas | Thousand m3 | 571.3 | 544.6 | -4.7 | |
| RUBruble million | 3.7 | 3.7 | 0.8 | ||
| Coal |
N.A. |
||||
| Oil shales |
N.A. |
||||
| Peat |
N.A. |
||||
| Others |
N.A. |
||||